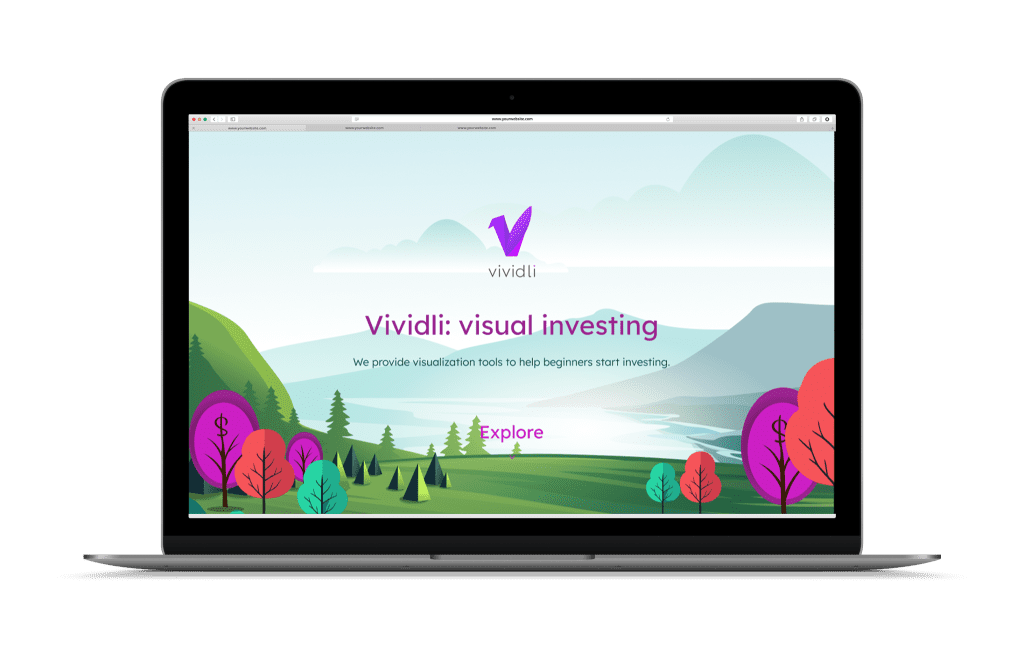
Vividli.ai caters to the investment needs of Generation Z beginners, providing a user-friendly investment calculator. The platform aims to simplify the investment process and empower young investors with knowledge and resources to start their investment journey. By demystifying financial data and offering an accessible platform, Vividli.ai addresses common challenges such as financial literacy, investment strategy planning, and risk assessment, removing barriers to entry for novice investors in the financial market.
Visualizes investments using various gadgets (e.g., laptops, iPhones, cars), allowing users to see what they can buy with their investments.
02
Chat Bot
An AI chat bot that addresses users’ daily queries and provides insightful answers, enhancing user engagement and support.
03
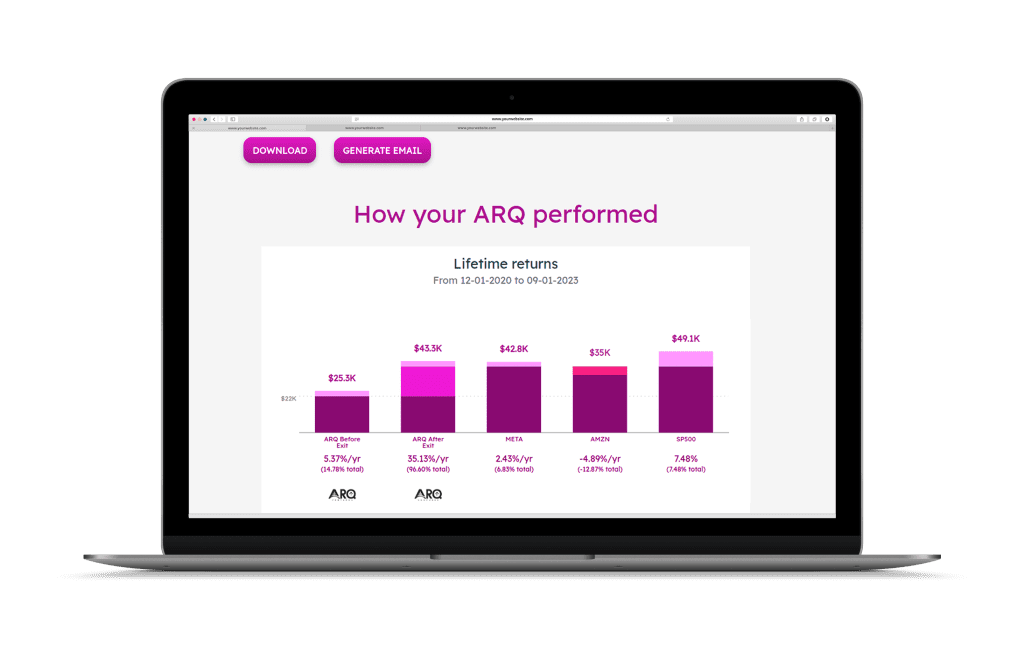
Investment Charts
Presents users’ investments in chart form, illustrating key metrics such as initial deposit, contributions, gains/losses, providing an overview and analysis of their investment performance.
Challenges
Financial Literacy and Investment Strategy Planning
Risk Assessment
User Engagement
Solution
Vividli.ai simplifies financial concepts and offers resources to educate users, empowering them to make informed investment decisions.
The platform provides tools and resources for users to assess and understand investment risks, enabling them to mitigate potential losses and make strategic investment decisions.
The inclusion of a chat bot enhances user engagement by providing personalized assistance and answering queries promptly, fostering a supportive environment for beginner investors.